Site-specific yield analysis
Assess yield potential using location, roof area, orientation and the solar path.

SOLART DIGITAL TWIN
SOLART visualises solar-tracker installations before implementation. Buildings, roofs, surroundings, shading and solar movement are represented in a 3D model, allowing tracker configurations to be compared and potential yield gains to be assessed in advance.
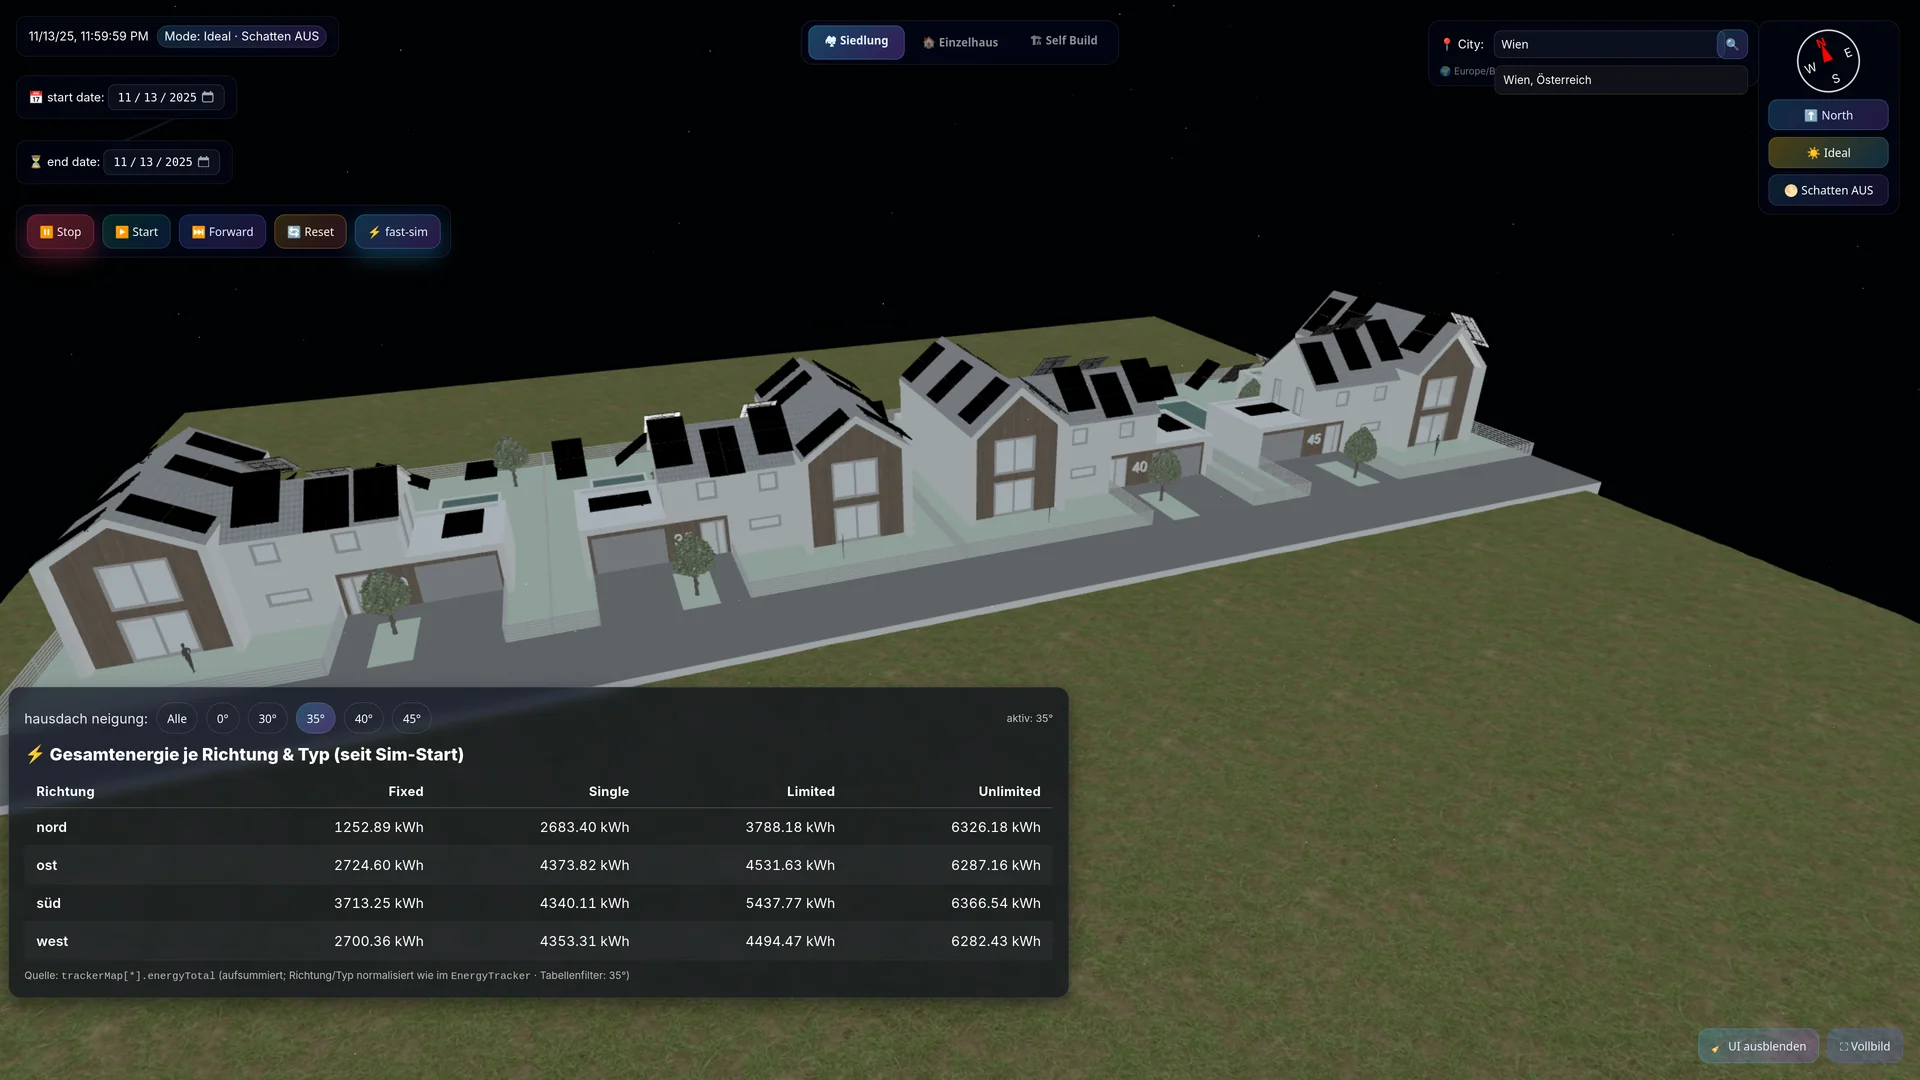
EXAMPLE SIMULATION
Roof pitch and orientation can be filtered and compared directly within the simulation.
EXAMPLE SIMULATION · VIENNA · SOUTH · 35° ROOF PITCH
| System | Energy yield |
|---|---|
| Fixed | ca. 3.713 kWh |
| Single | ca. 4.340 kWh |
| Limited | ca. 5.438 kWh |
| Unlimited | ca. 6.367 kWh |
Example simulation. Results depend on location, roof geometry, orientation, shading and the selected tracker configuration.
Assess yield potential using location, roof area, orientation and the solar path.
Prepare robust comparison data and present it transparently to customers.
Compare tracker configurations directly with fixed photovoltaic installations.
Give end customers a clear, visual understanding of the planned installation.
SOLART DIGITAL TWIN
Start planning your project.